时序分析实战之SARIMA、Linear model介绍

描述

1 数据准备

首先引入相关的 statsmodels,包含统计模型函数(时间序列)。

# 引入相关的统计包
import warnings  # 忽略警告
warnings.filterwarnings('ignore')

import numpy as np  # 矢量和矩阵
import pandas as pd  # 表格和数据操作
import matplotlib.pyplot as plt
import seaborn as sns
from dateutil.relativedelta import relativedelta  # 有风格地处理日期
from scipy.optimize import minimize  # 函数优化
import statsmodels.formula.api as smf  # 统计与经济计量
import statsmodels.tsa.api as smt
import scipy.stats as scs
from itertools import product
from tqdm import tqdm_notebook
import statsmodels.api as sm

用真实的手机游戏数据作为样例,研究每小时观看的广告数和每日所花的游戏币。

# 1 如真实的手机游戏数据,将调查每小时观看的广告和每天花费的游戏币
ads = pd.read_csv(r'./test/ads.csv', index_col=['Time'], parse_dates=['Time'])
currency = pd.read_csv(r'./test/currency.csv', index_col=['Time'], parse_dates=['Time'])

2 稳定性

建模前,先来了解一下稳定性(stationarity)。

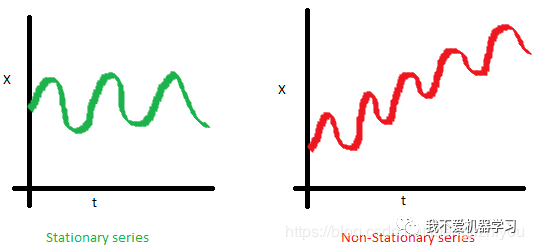
如果一个过程是平稳的,这意味着它不会随时间改变其统计特性,如均值和方差等等。

方差的恒常性称为同方差,协方差函数不依赖于时间,它只取决于观测值之间的距离。

非平稳过程是指分布参数或者分布规律随时间发生变化。也就是说,非平稳过程的统计特征是时间的函数(随时间变化)。

下面的红色图表不是平稳的:

  • 平均值随时间增加

时序分析

  • 方差随时间变化

时序分析

  • 随着时间的增加,距离变得越来越近。因此,协方差不是随时间而恒定的

时序分析

为什么平稳性如此重要呢? 通过假设未来的统计性质与目前观测到的统计性质不会有什么不同,可以很容易对平稳序列进行预测。

大多数的时间序列模型,以这样或那样的方式,试图预测那些属性(例如均值或方差)。

如果原始序列不是平稳的,那么未来的预测将是错误的。

大多数时间序列都是非平稳的,但可以(也应该)改变这一点。

平稳时间序列的类型:

  • 平稳过程(stationary process):产生平稳观测序列的过程。
  • 平稳模型(stationary model):描述平稳观测序列的模型。
  • 趋势平稳(trend stationary):不显示趋势的时间序列。
  • 季节性平稳(seasonal stationary):不表现出季节性的时间序列。
  • 严格平稳(strictly stationary):平稳过程的数学定义,特别指观测值的联合分布不受时移的影响。

若时序中有明显的趋势和季节性,则对这些成分建模,将它们从观察中剔除,然后用残差训练建模。

平稳性检查方法(可以检查观测值和残差):

  • 看图:绘制时序图,看是否有明显的趋势或季节性,如绘制频率图,看是否呈现高斯分布(钟形曲线)。
  • 概括统计:看不同季节的数据或随机分割或检查重要的差分,如将数据分成两部分,计算各部分的均值和方差,然后比较是否一样或同一范围内
  • 统计测试:选用统计测试检查是否有趋势和季节性

若时序的均值和方差相差过大,则有可能是非平稳序列,此时可以对观测值取对数,将指数变化转变为线性变化。然后再次查看取对数后的观测值的均值和方差以及频率图。

上面前两种方法常常会欺骗使用者,因此更好的方法是用统计测试 sm.tsa.stattools.adfuller()。

接下来将学习如何检测稳定性,从白噪声开始。

# 5经济计量方法(Econometric approach)
# ARIMA 属于经济计量方法
# 创建平稳序列
white_noise = np.random.normal(size=1000)
with plt.style.context('bmh'):
    plt.figure(figsize=(15,5))
    plt.plot(white_noise)

时序分析

标准正态分布产生的过程是平稳的,在0附近振荡,偏差为1。现在,基于这个过程将生成一个新的过程,其中每个后续值都依赖于前一个值。

def plotProcess(n_samples=1000,rho=0):
    x=w=np.random.normal(size=n_samples)
    for t in range(n_samples):
        x[t] = rho*x[t-1]+w[t]

    with plt.style.context('bmh'):
        plt.figure(figsize=(10,5))
        plt.plot(x)
        plt.title('Rho {}\\n Dickey-Fuller p-value: {}'.format(rho,round(sm.tsa.stattools.adfuller(x)[1],3)))

#-------------------------------------------------------------------------------------
for rho in [0,0.6,0.9,1]:
    plotProcess(rho=rho)

时序分析

时序分析

时序分析

时序分析

第一张图与静止白噪声一样。

第二张图,ρ增加至0.6,大的周期出现,但整体是静止的。

第三张图,偏离0均值,但仍然在均值附近震荡。

第四张图,ρ= 1,有一个随机游走过程即非平稳时间序列。当达到临界值时, 不返回其均值。从两边减去 ,得到 ,左边的表达式被称为 一阶差分

如果 ρ= 1,那么一阶差分等于平稳白噪声 。这是 Dickey-Fuller时间序列平稳性测试 (测试单位根的存在)背后的主要思想。

如果 可以用一阶差分从非平稳序列中得到平稳序列,称这些序列为1阶积分该检验的零假设是时间序列是非平稳的 ,在前三个图中被拒绝,在最后一个图中被接受。

1阶差分并不总是得到一个平稳的序列,因为这个过程可能是 d 阶的积分,d > 1阶的积分(有多个单位根)。在这种情况下,使用增广的Dickey-Fuller检验,它一次检查多个滞后时间。

可以使用不同的方法来去除非平稳性:各种顺序差分、趋势和季节性去除、平滑以及转换如Box-Cox或对数转换。

3 SARIMA

接下来开始建立ARIMA模型,在建模之前需要将非平稳时序转换为平稳时序。

3.1 去除非稳定性

摆脱非平稳性,建立SARIMA(Getting rid of non-stationarity and building SARIMA)

def tsplot(y,lags=None,figsize=(12,7),style='bmh'):
"""
Plot time series, its ACF and PACF, calculate Dickey-Fuller test
y:timeseries
lags:how many lags to include in ACF,PACF calculation
"""
ifnot isinstance(y, pd.Series):
y = pd.Series(y)

with plt.style.context(style):
     fig = plt.figure(figsize=figsize)
     layout=(2,2)
     ts_ax = plt.subplot2grid(layout, (0,0), colspan=2)
     acf_ax = plt.subplot2grid(layout, (1,0))
     pacf_ax = plt.subplot2grid(layout, (1,1))

     y.plot(ax=ts_ax)
     p_value = sm.tsa.stattools.adfuller(y)[1]
     ts_ax.set_title('Time Series Analysis Plots\\n Dickey-Fuller: p={0:.5f}'.format(p_value))
     smt.graphics.plot_acf(y,lags=lags, ax=acf_ax)
     smt.graphics.plot_pacf(y,lags=lags, ax=pacf_ax)
     plt.tight_layout()

#-------------------------------------------------------------------------------------
tsplot(ads.Ads, lags=60)

时序分析

从图中可以看出,Dickey-Fuller检验拒绝了单位根存在的原假设(p=0);序列是平稳的,没有明显的趋势,所以均值是常数,方差很稳定。

唯一剩下的是季节性,必须在建模之前处理它。可以通过季节差分去除季节性,即序列本身减去一个滞后等于季节周期的序列。

ads_diff = ads.Ads-ads.Ads.shift(24) # 去除季节性
tsplot(ads_diff[24:], lags=60)

ads_diff = ads_diff - ads_diff.shift(1) # 去除趋势
tsplot(ads_diff[24+1:], lags=60) # 最终图

时序分析

时序分析

第一张图中,随着季节性的消失,自回归好多了,但是仍存在太多显著的滞后,需要删除。首先使用一阶差分,用滞后1从自身中减去时序。

第二张图中,通过季节差分和一阶差分得到的序列在0周围震荡。Dickey-Fuller试验表明,ACF是平稳的,显著峰值的数量已经下降,可以开始建模了。

3.2 建 SARIMA 模型

SARIMA:Seasonal Autoregression Integrated Moving Average model。

是简单自回归移动平均的推广,并增加了积分的概念。

  • AR (p): 利用一个观测值和一些滞后观测值之间的依赖关系的模型。模型中的最大滞后称为p。要确定初始p,需要查看PACF图并找到最大的显著滞后,在此之后大多数其他滞后都变得不显著。
  • I (d): 利用原始观测值的差值(如观测值减去上一个时间步长的观测值)使时间序列保持平稳。这只是使该系列固定所需的非季节性差分的数量。在例子中它是1,因为使用了一阶差分。
  • MA (q):利用观测值与滞后观测值的移动平均模型残差之间的相关性的模型。目前的误差取决于前一个或前几个,这被称为q。初始值可以在ACF图上找到,其逻辑与前面相同

每个成分都对应着相应的参数。

SARIMA(p,d,q)(P,D,Q,s) 模型需要选择趋势和季节的超参数。

趋势参数 ,趋势有三个参数,与ARIMA模型的参数一样:

  • p: 模型中包含的滞后观测数,也称滞后阶数。
  • d: 原始观测值被差值的次数,也称为差值度。
  • q:移动窗口的大小,也叫移动平均的阶数

季节参数

  • S(s):负责季节性,等于单个季节周期的时间步长
  • P:模型季节分量的自回归阶数,可由PACF推导得到。但是需要看一下显著滞后的次数,是季节周期长度的倍数。如果周期等于24,看到24和48的滞后在PACF中是显著的,这意味着初始P应该是2。P=1将利用模型中第一次季节偏移观测,如t-(s*1)或t-24;P=2,将使用最后两个季节偏移观测值t-(s * 1), t-(s * 2)
  • Q:使用ACF图实现类似的逻辑
  • D:季节性积分的阶数(次数)。这可能等于1或0,取决于是否应用了季节差分。

可以通过分析ACF和PACF图来选择趋势参数,查看最近时间步长的相关性(如1,2,3)。

同样,可以分析ACF和PACF图,查看季节滞后时间步长的相关性来指定季节模型参数的值。

现在知道了如何设置初始参数,查看最终图并设置参数。

上面倒数第一张图就是最终图:

  • p:最可能是4,因为它是PACF上最后一个显著的滞后,在这之后,大多数其他的都不显著。
  • d:为1,因为我们计算了一阶差分
  • q:应该在4左右,就像ACF上看到的那样
  • P:可能是2,因为24和48的滞后对PACF有一定的影响
  • D:为1,因为计算了季节差分
  • Q:可能1,ACF的第24个滞后显著,第48个滞后不显著。

下面看不同参数的模型表现如何:

# 建模 SARIMA
# setting initial values and some bounds for them
ps = range(2,5)
d=1
qs=range(2,5)
Ps=range(0,2)
D=1
Qs=range(0,2)
s=24#season length

# creating list with all the possible combinations of parameters
parameters=product(ps,qs,Ps,Qs)
parameters_list = list(parameters)
print(parameters)
print(parameters_list)
print(len(parameters_list))
# 36
def optimizeSARIMA(parameters_list, d,D,s):
    """
    Return dataframe with parameters and corresponding AIC
    parameters_list:list with (p,q,P,Q) tuples
    d:integration order in ARIMA model
    D:seasonal integration order
    s:length of season
    """
    results = []
    best_aic = float('inf')

    for param in tqdm_notebook(parameters_list):
        # we need try-exccept because on some combinations model fails to converge
        try:
            model = sm.tsa.statespace.SARIMAX(ads.Ads, order=(param[0], d,param[1]),
                                              seasonal_order=(param[2], D,param[3], s)).fit(disp=-1)
        except:
            continue
        aic = model.aic
        # saving best model, AIC and parameters
        if aic< best_aic:
            best_model = model
            best_aic = aic
            best_param = param
        results.append([param, model.aic])

    result_table = pd.DataFrame(results)
    result_table.columns = ['parameters', 'aic']
    # sorting in ascending order, the lower AIC is - the better
    result_table = result_table.sort_values(by='aic',ascending=True).reset_index(drop=True)

    return result_table
%%time
result_table = optimizeSARIMA(parameters_list, d,D,s)

result_table.head()

# set the parameters that give the lowerst AIC
p,q,P,Q = result_table.parameters[0]
best_model = sm.tsa.statespace.SARIMAX(ads.Ads, order=(p,d,q),seasonal_order=(P,D,Q,s)).fit(disp=-1)
print(best_model.summary()) # 打印拟合模型的摘要。这总结了所使用的系数值以及对样本内观测值的拟合技巧。

# inspect the residuals of the model
tsplot(best_model.resid[24+1:], lags=60)
parameters          aic
0  (2, 3, 1, 1)  3888.642174
1  (3, 2, 1, 1)  3888.763568
2  (4, 2, 1, 1)  3890.279740
3  (3, 3, 1, 1)  3890.513196
4  (2, 4, 1, 1)  3892.302849

                                Statespace Model Results
==========================================================================================
Dep. Variable:                                Ads   No. Observations:                  216
Model:             SARIMAX(2, 1, 3)x(1, 1, 1, 24)   Log Likelihood               -1936.321
Date:                            Sun, 08 Mar 2020   AIC                           3888.642
Time:                                    23:06:23   BIC                           3914.660
Sample:                                09-13-2017   HQIC                          3899.181
                                     - 09-21-2017
Covariance Type:                              opg
==============================================================================
                 coef    std err          z      P  >|z|      [0.0250.975]
------------------------------------------------------------------------------
ar.L1          0.79130.2702.9280.0030.2621.321
ar.L2         -0.55030.306-1.7990.072-1.1500.049
ma.L1         -0.73160.262-2.7930.005-1.245-0.218
ma.L2          0.56510.2822.0050.0450.0131.118
ma.L3         -0.18110.092-1.9640.049-0.362-0.000
ar.S.L24       0.33120.0764.3510.0000.1820.480
ma.S.L24      -0.76350.104-7.3610.000-0.967-0.560
sigma2      4.574e+075.61e-098.15e+150.0004.57e+074.57e+07
===================================================================================
Ljung-Box (Q):                       43.70   Jarque-Bera (JB):                10.56
Prob(Q):                              0.32   Prob(JB):                         0.01
Heteroskedasticity (H):               0.65   Skew:                            -0.28
Prob(H) (two-sided):                  0.09   Kurtosis:                         4.00
===================================================================================
Warnings:
[1] Covariance matrix calculated using the outer product of gradients (complex-step).
[2] Covariance matrix is singular or near-singular, with condition number 8.82e+31. Standard errors may be unstable.

时序分析

很明显,残差是平稳的,不存在明显的自相关。可用我们的模型来预测。

def plotSARIMA(series, model, n_steps):
    """
    plot model vs predicted values
    series:dataset with timeseries
    model:fitted SARIMA model
    n_steps:number of steps to predict in the future
    """
    # adding model values
    data = series.copy()
    data.columns = ['actual']
    data['arima_model']=model.fittedvalues
    # making a shift on s+d steps, because these values were unobserved by the model due the differentiating
    data['arima_model'][:s+d]=np.nan

    # forecasting on n_steps forward
    forecast = model.predict(start=data.shape[0],end=data.shape[0]+n_steps)
    forecast = data.arima_model.append(forecast)
    # calculate error, again having shifted on s+d steps from the beginning
    error = mean_absolute_percentage_error(data['actual'][s+d:], data['arima_model'][s+d:])

    plt.figure(figsize=(15,7))
    plt.title('Mean Absolute Percentage Error: {0:.2f}%'.format(error))
    plt.plot(forecast,color='r',label='model')
    plt.axvspan(data.index[-1],forecast.index[-1], alpha=0.5,color='lightgrey')
    plt.plot(data.actual,label='actual')
    plt.legend()
    plt.grid(True)

#-------------------------------------------------------------------------------------
plotSARIMA(ads, best_model, 50)

时序分析

最后,得到了非常充分的预测。模型平均误差是3.94%,非常好。但准备数据、使序列平稳和选择参数的总成本可能不值得这么精确。

这一过程的步骤总结如下:

  • 模式识别:使用图表和汇总统计数据来确定趋势、季节性和自回归元素,从而了解差分的大小和所需的滞后的大小。
  • 参数估计:利用拟合程序求出回归模型的系数。
  • 模型检查:利用剩余误差的图和统计检验来确定模型没有捕捉到的时间结构的数量和类型。

4 线性模型

通常,在工作中必须以快速、好作为指导原则来建立模型。

一些模型不能拿来就用,因为它们需要太多的数据准备时间(如SARIMA),或者需要对新数据进行频繁的训练(SARIMA),或者很难调参(SARIMA)。因此,从现有的时间序列中选择几个特征并构建一个简单的线性回归模型,或者一个随机森林,通常要容易得多。

这种方法没有理论支持,并且打破了几个假设(例如高斯-马尔科夫定理,尤其是误差不相关的情况下),但是在实践中非常有用,经常在机器学习竞赛中使用。

4.1 特征提取

模型需要特征,但只有一维的时间序列。可以提取那些特征?

  • 时间序列窗口统计的滞后 :一个窗口中序列的最大值/最小值、一个窗口中值、窗口方差等。
  • 日期和时间特征 :一小时的第几分钟,一天的第几小时,一周的第几天等等
  • 特别的活动 :将其表示为布尔特征(注意,这种方式可能失去预测的速度)。让我们运行一些方法,看看我们可以从ads时间序列数据中提取什么。

接下来用这些方法提取特征。

4.1.1 滞后特征

将序列向后移动 n个时间点,得到一个特征列,其中时间序列的当前值与其在时间 t-n 时的值一致。

若进行一个 1 延迟移位,并对该特征训练模型,则该模型能够在观察到该序列的当前状态后提前预测1步。

增加滞后,比如增加到6,将允许模型提前6步做出预测,将使用6步前观察到的数据。

如果在这段未观察到的时间内,有什么东西从根本上改变了这个序列,那么模型就不会捕捉到这些变化,并且会返回带有很大误差的预测。因此,在初始滞后选择过程中,必须在最优预测质量与预测长度之间找到一个平衡点。

# 其他模型:线性...
# Creating a copy of the initial dataframe to make various transformations
data = pd.DataFrame(ads.Ads.copy())
data.columns=['y']

# Adding the lag of the target variable from 6 setps back up to 24
for i in range(6,25):
    data['lag_{}'.format(i)]=data.y.shift(i)

# take a look at the new dataframe
data.tail(7)
y     lag_6    ...       lag_23    lag_24
Time                                     ...
2017-09-2117:00:00151790132335.0    ...     146215.0139515.0
2017-09-2118:00:00155665146630.0    ...     142425.0146215.0
2017-09-2119:00:00155890141995.0    ...     123945.0142425.0
2017-09-2120:00:00123395142815.0    ...     101360.0123945.0
2017-09-2121:00:00103080146020.0    ...      88170.0101360.0
2017-09-2122:00:0095155152120.0    ...      76050.088170.0
2017-09-2123:00:0080285151790.0    ...      70335.076050.0
[7 rows x 20 columns]
from sklearn.linear_model import LinearRegression
from sklearn.model_selection import cross_val_score

# for time-series cross-validation set 5 folds
tscv = TimeSeriesSplit(n_splits=5)

def timeseries_train_test_split(X,y,test_size):
    """
    Perform train-test split with respect to time series structure
    """
    # get the index after which test set starts
    test_index = int(len(X)*(1-test_size))
    X_train = X.iloc[:test_index]
    y_train = y.iloc[:test_index]
    X_test = X.iloc[test_index:]
    y_test = y.iloc[test_index:]
    return X_train,X_test,y_train,y_test

#-------------------------------------------------------------------------------------
y = data.dropna().y
X = data.dropna().drop(['y'],axis=1)

# reserve 30% of data for testing
X_train, X_test, y_train, y_test =timeseries_train_test_split(X,y,test_size=0.3)

#-------------------------------------------------------------------------------------
# machine learning in two lines
lr = LinearRegression()
lr.fit(X_train, y_train)

#-------------------------------------------------------------------------------------
def plotModelResults(model, X_train=X_train, X_test=X_test, plot_intervals=False, plot_anomalies=False):
    """
    Plot modelled vs fact values, prediction intervals and anomalies
    """
    prediction = model.predict(X_test)

    plt.figure(figsize=(15,7))
    plt.plot(prediction,'g',label='prediction', linewidth=2.0)
    plt.plot(y_test.values, label='actual', linewidth=2.0)

    if plot_intervals:
        cv = cross_val_score(model, X_train, y_train, cv=tscv, scoring='neg_mean_absolute_error')
        mae = cv.mean() *(-1)
        deviation = cv.std()

        scale=1.96
        lower = prediction-(mae + scale * deviation)
        upper = prediction + (mae + scale *deviation)

        plt.plot(lower, 'r--', label='upper bond / lower bond', alpha=0.5)
        plt.plot(upper, 'r--', alpha=0.5)

    if plot_anomalies:
        anomalies = np.array([np.nan]*len(y_test))
        anomalies[y_test< lower] = y_test[y_test< lower]
        anomalies[y_test >upper] = y_test[y_test >upper]
        plt.plot(anomalies, 'o', markersize=10, label='Anomalies')

    error = mean_absolute_percentage_error(prediction, y_test)
    plt.title('Mean absolute percentage error {0:.2f}%'.format(error))
    plt.legend(loc='best')
    plt.tight_layout()
    plt.grid(True)


def plotCoefficients(model):
    """
    PLots sorted coefficient values of the model
    """

    coefs = pd.DataFrame(model.coef_, X_train.columns)
    print()
    coefs.columns = ['coef']
    coefs['abs'] = coefs.coef.apply(np.abs)
    coefs = coefs.sort_values(by='abs', ascending=False).drop(['abs'],axis=1)

    plt.figure(figsize=(15, 7))
    coefs.coef.plot(kind='bar')
    plt.grid(True, axis='y')
    plt.hlines(y=0,xmin=0, xmax=len(coefs), linestyles='dashed')

#-------------------------------------------------------------------------------------
plotModelResults(lr, plot_intervals=True)
plotCoefficients(lr)

时序分析

时序分析

简单的滞后和线性回归的预测在质量方面与SARIMA差不多。有许多不必要的特征,稍后将进行特征选择。

接下来提取时间特征。

4.1.2 时间特征

# 提取时间特征 hour、day of week、is_weekend
data.index = pd.to_datetime(data.index)
data['hour'] = data.index.hour
data['weekday'] = data.index.weekday
data['is_weekend'] = data.weekday.isin([5,6])*1
data.tail()

#-------------------------------------------------------------------------------------
# 可视化特征
plt.figure(figsize=(16,5))
plt.title('Encoded features')
data.hour.plot()
data.weekday.plot()
data.is_weekend.plot()
plt.grid(True)
y     lag_6     ...      weekday  is_weekend
Time                                      ...
2017-09-2119:00:00155890141995.0     ...            30
2017-09-2120:00:00123395142815.0     ...            30
2017-09-2121:00:00103080146020.0     ...            30
2017-09-2122:00:0095155152120.0     ...            30
2017-09-2123:00:0080285151790.0     ...            30
[5 rows x 23 columns]

时序分析

因为现在的变量中有不同的尺度,滞后特征有数千,分类特征有数十,我们需要将它们转换成相同的尺度,以探索特征的重要性,然后是正则化。

4.2 归一化

# 特征的尺度不一样,需要归一化

from sklearn.preprocessing import StandardScaler
scaler = StandardScaler()

y = data.dropna().y
X = data.dropna().drop(['y'], axis=1)
X_train, X_test, y_train, y_test =timeseries_train_test_split(X,y,test_size=0.3)
X_train_scaled = scaler.fit_transform(X_train)
X_test_scaled = scaler.transform(X_test)

lr = LinearRegression()
lr.fit(X_train_scaled, y_train)

#-------------------------------------------------------------------------------------
plotModelResults(lr, X_train=X_train_scaled, X_test=X_test_scaled, plot_intervals=True)
plotCoefficients(lr)

时序分析

时序分析

4.3 目标编码

def code_mean(data, cat_feature, real_feature):
    """
    Returns a dictionary where keys are unique categories of the cat_feature,
    and values are means over real_feature
    """
    return dict(data.groupby(cat_feature)[real_feature].mean())

average_hour = code_mean(data, 'hour', 'y')
plt.figure(figsize=(7,5))
plt.title('Hour averages')
pd.DataFrame.from_dict(average_hour, orient='index')[0].plot()
plt.grid(True)

时序分析

把所有的变换放在一个函数中:

# 将所有的数据准备结合到一起
def prepareData(series, lag_start, lag_end, test_size, target_encoding=False):
    """
    series: pd.DataFrame or dataframe with timeseries
    lag_start: int, initial step back in time to slice target variable
               example-lag_start=1 means that the model will see yesterday's values to predict today
    lag_end: int, finial step back in time to slice target variable
             example-lag_end=4 means that the model will see up to 4 days back in time to predict today
    test_size:float, size of the test dataset after train/test split as percentage of dataset
    target_encoding:boolean, if True -  add target averages to dataset
    """

    # copy of the initial dataset
    data = pd.DataFrame(series.copy())
    data.columns = ['y']

    # lags of series
    for i in range(lag_start, lag_end):
        data['lag_{}'.format(i)]=data.y.shift(i)

    # datatime features
    data.index = pd.to_datetime(data.index)
    data['hour'] = data.index.hour
    data['weekday'] =data.index.weekday
    data['is_weekend']=data.weekday.isin([5,6])*1

    if target_encoding:
        # calculate averages on train set only
        test_index = int(len(data.dropna())*(1-test_size))
        data['weekday_average'] = list(map(code_mean(data[:test_index], 'weekday', 'y').get, data.weekday))
        data['hour_average'] = list(map(code_mean(data[:test_index], 'hour', 'y').get, data.hour))

        # drop encoded variables
        data.drop(['hour', 'weekday'], axis=1, inplace=True)

    # train-test split
    y = data.dropna().y
    X = data.dropna().drop(['y'], axis=1)
    X_train, X_test, y_train, y_test = timeseries_train_test_split(X, y, test_size=test_size)

    return X_train, X_test, y_train, y_test

#-------------------------------------------------------------------------------------
X_train, X_test, y_train, y_test = prepareData(ads.Ads, lag_start=6, lag_end=25, test_size=0.3, target_encoding=True)

X_train_scaled = scaler.fit_transform(X_train)
X_test_scaled = scaler.transform(X_test)

lr = LinearRegression()
lr.fit(X_train_scaled, y_train)

plotModelResults(lr, X_train=X_train_scaled, X_test=X_test_scaled, plot_intervals=True, plot_anomalies=True)
plotCoefficients(lr)
# plt.xticks(rotation=45, fontsize=7)

时序分析

时序分析

从图中可以看出,存在过拟合。Hour_average在训练数据集中系数过大,以至于模型决定都集中在它上面。结果,预测的质量下降了。这个问题可以用多种方法解决:例如,我们可以计算目标编码而不是整个训练集,而是针对某个窗口。这样,来自最后一个观察到的窗口的编码将很可能更好地描述当前的序列状态。或者,可以手动删除它,因为我们确信在这种情况下它只会使事情变得更糟。

X_train, X_test, y_train, y_test = prepareData(ads.Ads, lag_start=6, lag_end=25, test_size=0.3, target_encoding=False)

X_train_scaled = scaler.fit_transform(X_train)
X_test_scaled = scaler.transform(X_test)

4.4 正则化

并不是所有的特征都是有用的,有些可能会导致过拟合,有些应该被删除。

除了人工检查,还可以采用正则化。

两个有名的正则化回归模型是岭回归和套索回归 ^[2]^ 。它们都给损失函数增加了一些约束。

在岭回归的情况下,这些约束是系数乘正则化系数的平方和。一个特征的系数越大,损失就越大。因此,尽量优化模型,同时保持系数相当低。L2正则化的结果,将有更高的偏差和更低的方差,因此模型泛化性能更好。

第二个回归模型是Lasso回归,它将损失函数添加到系数的绝对值中,而不是平方。因此,在优化过程中,不重要的特征的系数可能变成零,从而允许自动选择特征。这种正则化类型称为L1。

首先,确定有要删除的特征,并且数据具有高度相关的特征。

# 若过拟合,对特征进行正则化
# 先看一下特征之间的相关性
y = data.dropna().y
X = data.dropna().drop(['y'], axis=1)
X_train, X_test, y_train, y_test =timeseries_train_test_split(X,y,test_size=0.3)
X_train_scaled = scaler.fit_transform(X_train)
X_test_scaled = scaler.transform(X_test)

plt.figure(figsize=(10,8))
sns.heatmap(X_train.corr())

时序分析

# 开始正则化
# 岭回归
from sklearn.linear_model import LassoCV, RidgeCV

ridge = RidgeCV(cv=tscv)
ridge.fit(X_train_scaled,y_train)
plotModelResults(ridge, X_train=X_train_scaled,X_test=X_test_scaled, plot_intervals=True, plot_anomalies=True)
plotCoefficients(ridge)

时序分析

时序分析

可以清楚地看到,随着它们在模型中的重要性下降,一些系数正越来越接近于零(尽管它们从未真正达到零)。

# 套索回归
lasso = LassoCV(cv=tscv)
lasso.fit(X_train_scaled,y_train)
plotModelResults(lasso, X_train=X_train_scaled,X_test=X_test_scaled, plot_intervals=True, plot_anomalies=True)
plotCoefficients(lasso)

时序分析

时序分析

套索回归被证明是更保守的。它从最重要的特征中去除了23的延迟,并完全去掉了5个特征,这提高了预测的质量。

下面尝试用XGBoost建模。

5 Boosting

# 预测模型 Boosting
from xgboost import XGBRegressor

xgb = XGBRegressor()
xgb.fit(X_train_scaled, y_train)
plotModelResults(xgb, X_train=X_train_scaled,X_test=X_test_scaled, plot_intervals=True, plot_anomalies=True)

时序分析

这是到目前为止测试过的所有模型中测试集上误差最小的。但是,这具有欺骗性。得到时间序列数据,不适合先用xgboost。

通常,与线性模型相比,基于树的模型处理数据趋势的能力较差。在这种情况下,您必须先停止使用序列,或者使用一些技巧来实现这个魔术。

理想情况下,您可以使该系列平稳,然后使用XGBoost。例如,可以使用线性模型预测趋势,然后加上xgboost的预测以获得最终预测。

打开APP阅读更多精彩内容
声明:本文内容及配图由入驻作者撰写或者入驻合作网站授权转载。文章观点仅代表作者本人,不代表电子发烧友网立场。文章及其配图仅供工程师学习之用,如有内容侵权或者其他违规问题,请联系本站处理。 举报投诉

全部0条评论

快来发表一下你的评论吧 !

×
20
完善资料,
赚取积分