资料下载

在图形LCD Phidget(LCD1100)上显示天气
描述
在这个项目中,我们将使用在线天气服务在图形 LCD Phidget (LCD1100) 上显示当地天气和时间。此项目的 C# 和 Python 代码可用。
补给品
使用以下硬件:
- VINT 集线器 Phidget (HUB0000_0)
- 图形 LCD Phidget (LCD1100_0)
第 1 步:设置
通过任何端口将您的图形 LCD Phidget 连接到您的 VINT 集线器。
第 2 步:概述

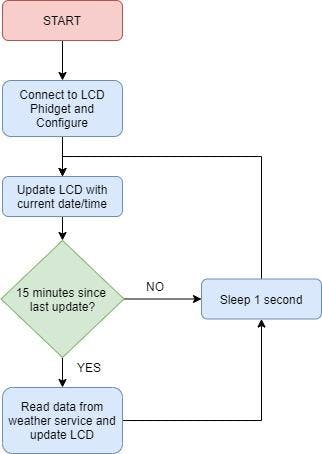
如上所示,这个项目有两个主要部分:
- 访问天气数据
- 显示天气数据
让我们先来看看访问数据。
第 3 步:访问天气数据

我们将使用OpenWeather访问我们当地的天气预报。他们提供免费访问超过 200,000 个城市的天气预报。支持以下格式:
- JSON
- XML
- HTML
对于这个项目,我们将使用 XML 格式。
为了访问天气数据,您必须创建一个免费帐户并获取 API 密钥。
第 4 步:创建您的帐户

按照此链接创建免费帐户并获取 API 密钥。获取 API 密钥后,您可以通过以下 URL 访问数据:
api.openweathermap.org/data/2.5/weather?q={city name}&appid={API key}
将 {city name} 替换为您的城市,将 {API key} 替换为您的 API 密钥。例如,这就是我们的样子:
http://api.openweathermap.org/data/2.5/weather?q=Calgary&APPID=fakeid111111111111111111111111111&units=metric&mode=xml
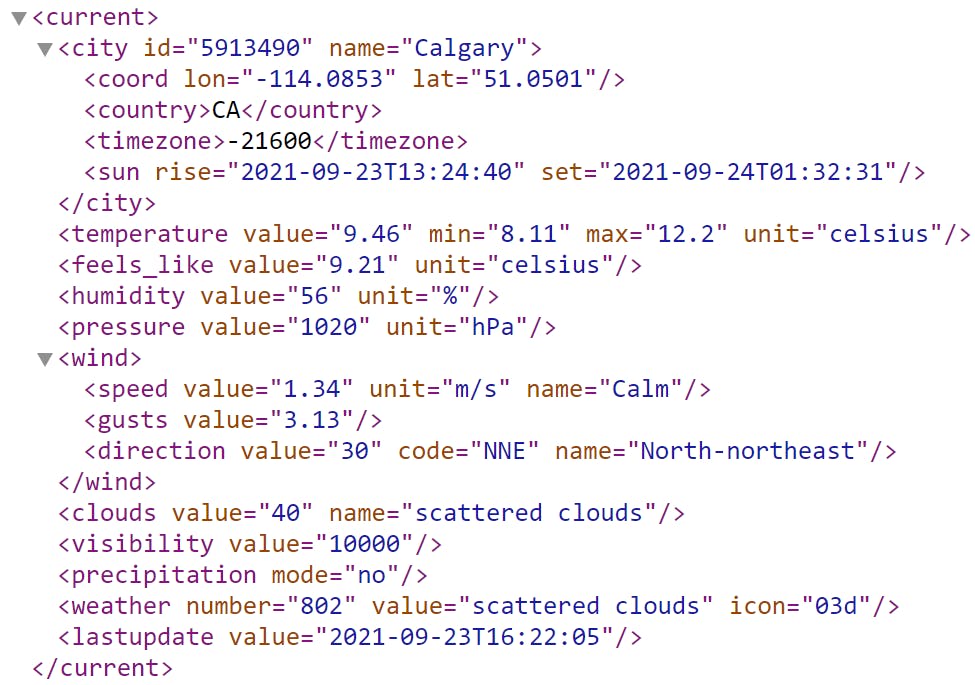
尝试在任何网络浏览器中输入您的 URL。您将看到 XML 格式的天气数据,如上所示。下一步是创建一个可以解析数据以便显示的程序。
第 5 步:读取/解析天气数据 - C#
对于 C#,您可以使用XMLTextReader类来快速解析 XML 数据:
static string readXML(string arg1, string arg2)
{
String URLString = "http://api.openweathermap.org/data/2.5/weather?q=Calgary&APPID=fakeid111111111111111111111111111&units=metric&mode=xml";
XmlTextReader reader = new XmlTextReader(URLString);
reader.ReadToFollowing(arg1);
reader.MoveToAttribute(arg2);
return reader.Value;
}
您可以像这样使用上面的函数:
static void updateWeather(LCD lcd) {
string city = readXML("city", "name");
string temperature = readXML("temperature", "value");
string humidity = readXML("humidity", "value");
string windspeed = readXML("speed", "value");
string descript = readXML("weather", "value");
string iconID = readXML("weather", "icon");
}
还有其他可用的值(日出时间、日落时间、压力等),但对于这个项目,我们将只显示值的子集。
第 6 步:读取/解析天气数据 - Python
对于 Python,您可以使用 ElementTree XML API 快速解析数据:
import xml.etree.ElementTree as ET
from urllib.request import urlopen
url = urlopen('http://api.openweathermap.org/data/2.5/weather?q=Calgary&APPID=fakeid111111111111111111111111111&units=metric&mode=xml')
tree = ET.parse(url)
root = tree.getroot()
def readXML(arg1, arg2):
for item in root.iter(arg1):
return item.get(arg2)
print(readXML('city','name'))
print(readXML('temperature','value'))
print(readXML('humidity','value'))
print(readXML('speed','value'))
print(readXML('weather','value'))
print(readXML('weather','icon'))
还有其他可用的值(日出时间、日落时间、压力等),但对于这个项目,我们将只显示值的子集。
第 7 步:OpenWeather 图标
您可能已经注意到我们在上面存储了iconID 。此值表示描述当前天气的图像。您可以在此处查看图标。Graphic LCD Phidget 能够显示位图,我们可以在我们的程序中轻松实现这些图标。如果您还没有探索过图形 LCD Phidget 上的位图,请查看这个项目。
网上有很多像素艺术程序,我们使用了 Piskel。由于简单的“导出到 C 文件”选项,重新创建 OpenWeatherMap 图标很容易。位图的结果在下面的 github 存储库中提供。
第 8 步:显示数据 - C#
现在我们已经收集了天气数据,最后一步是将其显示在图形 LCD Phidget 上:
static void updateWeather(LCD lcd)
{
string city = readXML("city", "name");
string temperature = readXML("temperature", "value");
string humidity = readXML("humidity", "value");
string windspeed = readXML("speed", "value");
string descript = readXML("weather", "value");
string iconID = readXML("weather", "icon");
if (temperature.Length > 5)
{
temperature = temperature.Remove(5);
}
//Temperature box
int x = (44 - ((temperature.Length * 6) + 12)) / 2;
lcd.WriteText(LCDFont.Dimensions_6x12, x, 15, temperature);
lcd.WriteText(LCDFont.User1, x + temperature.Length * 6, 15, "0");
lcd.WriteText(LCDFont.Dimensions_6x12, x + temperature.Length * 6 + 6, 15, "C");
//Weather image + descript box
byte[] temp;
if (iconID == "01d")
temp = _01d;
else if (iconID == "02d")
temp = _02d;
else if (iconID == "03d")
temp = _03d;
else if (iconID == "04d")
temp = _04d;
else if (iconID == "09d")
temp = _09d;
else if (iconID == "10d")
temp = _10d;
else if (iconID == "11d")
temp = _11d;
else if (iconID == "13d")
temp = _13d;
else if (iconID == "50d")
temp = _50d;
else if (iconID == "01n")
temp = _01n;
else if (iconID == "02n")
temp = _02n;
else if (iconID == "10n")
temp = _10n;
else
temp = unknown;
lcd.WriteBitmap(2, 31, 32, 32, temp);
lcd.WriteText(LCDFont.Dimensions_5x8, 40, 42, descript);
//Extra info box
lcd.WriteText(LCDFont.Dimensions_5x8, 50, 11, "Humidity: " + humidity + "%");
lcd.WriteText(LCDFont.Dimensions_5x8, 50, 20, "Wind: " + windspeed + "km/h");
}
static void redraw(LCD lcd)
{
lcd.Clear();
//draw borders around outside
lcd.DrawLine(0, 0, 127, 0);
lcd.DrawLine(0, 0, 0, 63);
lcd.DrawLine(127, 0, 127, 63);
lcd.DrawLine(0, 63, 127, 63);
//draw borders inside
lcd.DrawLine(0, 10, 128, 10);
lcd.DrawLine(43, 10, 43, 30);
lcd.DrawLine(1, 30, 127, 30);
lcd.WriteText(LCDFont.Dimensions_5x8, 1, 1, DateTime.Now.ToString(" ddd, MMM d hh:mm:ss tt"));
updateWeather(lcd);
lcd.Flush();
}
下面是对上面代码的快速回顾:
重绘
此函数在图形 LCD 上绘制主要边框。它还打印当前时间并调用 updateWeather 程序。
更新天气
此功能将来自 OpenWeather 服务的数据排列到图形 LCD 上。
第 9 步:显示数据 - Python
现在我们已经收集了天气数据,最后一步是将其显示在图形 LCD Phidget 上:
def updateWeather():
city = readXML('city', 'name')
temperature = readXML('temperature', 'value')
humidity = readXML('humidity', 'value')
windspeed = readXML('speed', 'value')
descript = readXML('weather', 'value')
iconID = readXML('weather', 'icon')
if(len(temperature) > 5):
temperature = temperature[:-1:] #remove last char so it fits
#temperature box
x = (44 - ((len(temperature) * 6) + 12)) / 2
x = int(x) #force to int
lcd.writeText(LCDFont.FONT_6x12, x, 15, temperature)
lcd.writeText(LCDFont.FONT_User1, x + len(temperature) * 6, 15, "0")
lcd.writeText(LCDFont.FONT_6x12, x + len(temperature) * 6 + 6, 15, "C")
#Weather icon + descript box
temp = []
if(iconID == "01d"):
temp = _01d
elif(iconID == "02d"):
temp = _02d
elif (iconID == "03d"):
temp = _03d
elif (iconID == "04d"):
temp = _04d
elif (iconID == "09d"):
temp = _09d
elif (iconID == "10d"):
temp = _10d
elif (iconID == "11d"):
temp = _11d
elif (iconID == "13d"):
temp = _13d
elif (iconID == "50d"):
temp = _50d
elif (iconID == "01n"):
temp = _01n
elif (iconID == "02n"):
temp = _02n
elif (iconID == "10n"):
temp = _10n
else:
temp = unknown
lcd.writeBitmap(2, 31, 32, 32, temp)
lcd.writeText(LCDFont.FONT_5x8, 40, 42, descript)
#Extra info box
lcd.writeText(LCDFont.FONT_5x8, 50, 11, "Humidity: " + humidity + "%")
lcd.writeText(LCDFont.FONT_5x8, 50, 20, "Wind: " + windspeed + "km/h")
def redraw():
lcd.clear()
#Draw borders around outside
lcd.drawLine(0, 0, 127, 0)
lcd.drawLine(0, 0, 0, 63)
lcd.drawLine(127, 0, 127, 63)
lcd.drawLine(0, 63, 127, 63)
#draw borders inside
lcd.drawLine(0, 10, 128, 10)
lcd.drawLine(43, 10, 43, 30)
lcd.drawLine(1, 30, 127, 30)
timeStr = datetime.now().strftime("%a, %b %d %I:%M:%S %p")
lcd.writeText(LCDFont.FONT_5x8, 1, 1, timeStr)
updateWeather()
lcd.flush()
下面是对上面代码的快速回顾:redraw
此函数在图形 LCD 上绘制主要边框。它还打印当前时间并调用 updateWeather 程序。
更新天气
此功能将来自 OpenWeather 服务的数据排列到图形 LCD 上。
第 10 步:主循环
最后要做的是创建一个主循环,按设定的时间表更新 LCD。以下是我们的推荐:
- 每秒:更新液晶显示屏上的时间
- 每 15 分钟:更新 LCD 上的天气状态
创建一个每秒循环的无限循环。创建一个计数器来跟踪循环,当计数器达到 900(900 秒是 15 分钟)时更新天气。
第 11 步:继续前进
该项目的完整代码可在此处获得:https ://github.com/phidgeteer/LCDWeather.git
如果您有任何疑问,请在下面发表评论!
声明:本文内容及配图由入驻作者撰写或者入驻合作网站授权转载。文章观点仅代表作者本人,不代表电子发烧友网立场。文章及其配图仅供工程师学习之用,如有内容侵权或者其他违规问题,请联系本站处理。 举报投诉
- 相关下载
- 相关文章


