
蚁群算法python编程实现
编程实验
描述
前言
这篇文章主要介绍了Python编程实现蚁群算法详解,涉及蚂蚁算法的简介,主要原理及公式,以及Python中的实现代码,具有一定参考价值,需要的朋友可以了解下。
蚁群算法简介
蚁群算法(ant colony optimization, ACO),又称蚂蚁算法,是一种用来在图中寻找优化路径的机率型算法。它由Marco Dorigo于1992年在他的博士论文中提出,其灵感来源于蚂蚁在寻找食物过程中发现路径的行为。蚁群算法是一种模拟进化算法,初步的研究表明该算法具有许多优良的性质。针对PID控制器参数优化设计问题,将蚁群算法设计的结果与遗传算法设计的结果进行了比较,数值仿真结果表明,蚁群算法具有一种新的模拟进化优化方法的有效性和应用价值。
蚁群算法定义
各个蚂蚁在没有事先告诉他们食物在什么地方的前提下开始寻找食物。当一只找到食物以后,它会向环境释放一种挥发性分泌物pheromone (称为信息素,该物质随着时间的推移会逐渐挥发消失,信息素浓度的大小表征路径的远近)来实现的,吸引其他的蚂蚁过来,这样越来越多的蚂蚁会找到食物。有些蚂蚁并没有像其它蚂蚁一样总重复同样的路,他们会另辟蹊径,如果另开辟的道路比原来的其他道路更短,那么,渐渐地,更多的蚂蚁被吸引到这条较短的路上来。最后,经过一段时间运行,可能会出现一条最短的路径被大多数蚂蚁重复着。
蚁群算法解决的问题
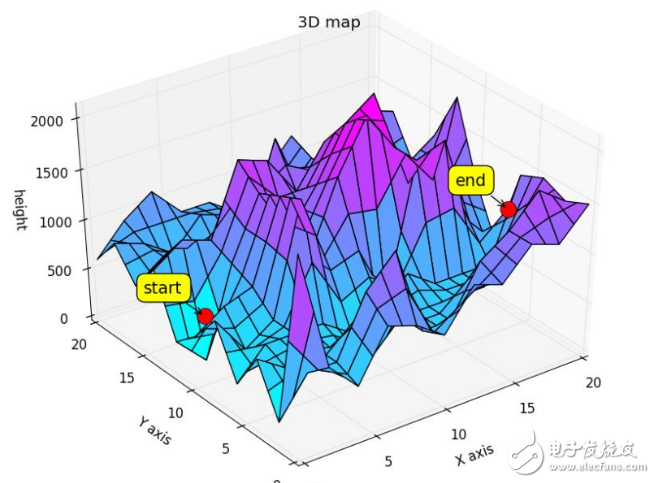
三维地形中,给出起点和重点,找到其最优路径。

作图源码:
from mpl_toolkits.mplot3d
import proj3dfrom mpl_toolkits.mplot3d
import Axes3Dimport numpy as np
height3d = np.array([[2000,1400,800,650,500,750,1000,950,900,800,700,900,1100,1050,1000,1150,1300,1250,1200,1350,1500], [1100,900,700,625,550,825,1100,1150,1200,925,650,750,850,950,1050,1175,1300,1350,1400,1425,1450], [200,400,600,600,600,900,1200,1350,1500,1050,600,600,600,850,1100,1200,1300,1450,1600,1500,1400], [450,500,550,575,600,725,850,875,900,750,600,600,600,725,850,900,950,1150,1350,1400,1450], [700,600,500,550,600,550,500,400,300,450,600,600,600,600,600,600,600,850,1100,1300,1500], [500,525,550,575,600,575,550,450,350,475,600,650,700,650,600,600,600,725,850,1150,1450], [300,450,600,600,600,600,600,500,400,500,600,700,800,700,600,600,600,600,600,1000,1400], [550,525,500,550,600,875,1150,900,650,725,800,700,600,875,1150,1175,1200,975,750,875,1000], [800,600,400,500,600,1150,1700,1300,900,950,1000,700,400,1050,1700,1750,1800,1350,900,750,600], [650,600,550,625,700,1175,1650,1275,900,1100,1300,1275,1250,1475,1700,1525,1350,1200,1050,950,850], [500,600,700,750,800,1200,1600,1250,900,1250,1600,1850,2100,1900,1700,1300,900,1050,1200,1150,1100], [400,375,350,600,850,1200,1550,1250,950,1225,1500,1750,2000,1950,1900,1475,1050,975,900,1175,1450], [300,150,0,450,900,1200,1500,1250,1000,1200,1400,1650,1900,2000,2100,1650,1200,900,600,1200,1800], [600,575,550,750,950,1275,1600,1450,1300,1300,1300,1525,1750,1625,1500,1450,1400,1125,850,1200,1550], [900,1000,1100,1050,1000,1350,1700,1650,1600,1400,1200,1400,1600,1250,900,1250,1600,1350,1100,1200,1300], [750,850,950,900,850,1000,1150,1175,1200,1300,1400,1325,1250,1125,1000,1150,1300,1075,850,975,1100], [600,700,800,750,700,650,600,700,800,1200,1600,1250,900,1000,1100,1050,1000,800,600,750,900], [750,775,800,725,650,700,750,775,800,1000,1200,1025,850,975,1100,950,800,900,1000,1050,1100], [900,850,800,700,600,750,900,850,800,800,800,800,800,950,1100,850,600,1000,1400,1350,1300], [750,800,850,850,850,850,850,825,800,750,700,775,850,1000,1150,875,600,925,1250,1100,950], [600,750,900,1000,1100,950,800,800,800,700,600,750,900,1050,1200,900,600,850,1100,850,600]])
fig = figure()
ax = Axes3D(fig)
X = np.arange(21)
Y = np.arange(21)
X, Y = np.meshgrid(X, Y)
Z = -20*np.exp(-0.2*np.sqrt(np.sqrt(((X-10)**2+(Y-10)**2)/2)))+20+np.e-np.exp((np.cos(2*np.pi*X)+np.sin(2*np.pi*Y))/2)
蚁群算法基本原理
蚂蚁k根据各个城市间链接路径上的信息素浓度决定其下一个访问城市,设Pkij(t)表示t时刻蚂蚁k从城市i转移到矩阵j的概率,其计算公式为

计算完城市间的转移概率后,采用与遗传算法中一样的轮盘赌方法选择下一个待访问的城市。
当所有的蚂蚁完成一次循环后,各个城市间链接路径上的信息素浓度需进行更新,计算公式为

其中,Δτkij表示第k只蚂蚁在城市i与城市j连接路径上释放的信息素浓度;Δτij表示所有蚂蚁在城市i与城市j连接路径上释放的信息素浓度之和。
蚂蚁释放信息素的模型

ax.plot_surface(X, Y, Z, rstride=1, cstride=1, cmap=‘cool’)
ax.set_xlabel(‘X axis’)
ax.set_ylabel(‘Y axis’)
ax.set_zlabel(‘Z’)
ax.set_title(‘3D map’)
point0 = [0,9,Z[0][9]] point1 = [20,7,Z[20][7]]
ax.plot([point0[0]],[point0[1]],[point0[2]],‘r’,marker = u‘o’,markersize = 15)ax.plot([point1[0]],[point1[1]],[point1[2]],‘r’,marker = u‘o’,markersize = 15)
x0,y0,_ = proj3d.proj_transform(point0[0],point0[1],point0[2], ax.get_proj())x1,y1,_ = proj3d.proj_transform(point1[0],point1[1],point1[2], ax.get_proj())
label = pylab.annotate(
“start”,
xy = (x0, y0), xytext = (-20, 20),
textcoords = ‘offset points’, ha = ‘right’, va = ‘bottom’,
bbox = dict(boxstyle = ‘round,pad=0.5’, fc = ‘yellow’, alpha = 1), arrowprops = dict(arrowstyle = ‘-》’, connectionstyle = ‘arc3,rad=0’),fontsize=15)label2 = pylab.annotate(
“end”,
xy = (x1, y1), xytext = (-20, 20),
textcoords = ‘offset points’, ha = ‘right’, va = ‘bottom’,
bbox = dict(boxstyle = ‘round,pad=0.5’, fc = ‘yellow’, alpha = 1),
arrowprops = dict(arrowstyle = ‘-》’, connectionstyle = ‘arc3,rad=0’),fontsize=15)
def update_position(e): x2, y2, _ = proj3d.proj_transform(point0[0],point0[1],point0[2],ax.get_proj())
label.xy = x2,y2
label.update_positions(fig.canvas.renderer)
x1,y1,_ = proj3d.proj_transform(point1[0],point1[1],point1[2],ax.get_proj())
label2.xy = x1,y1
label2.update_positions(fig.canvas.renderer)
fig.canvas.draw()
fig.canvas.mpl_connect(‘button_release_event’, update_position)
import numpy as npimport matplotlib.pyplot as plt%pylabcoordinates = np.array([[565.0,575.0],[25.0,185.0],[345.0,750.0],[945.0,685.0],[845.0,655.0], [880.0,660.0],[25.0,230.0],[525.0,1000.0],[580.0,1175.0],[650.0,1130.0], [1605.0,620.0],[1220.0,580.0],[1465.0,200.0],[1530.0, 5.0],[845.0,680.0], [725.0,370.0],[145.0,665.0],[415.0,635.0],[510.0,875.0],[560.0,365.0], [300.0,465.0],[520.0,585.0],[480.0,415.0],[835.0,625.0],[975.0,580.0], [1215.0,245.0],[1320.0,315.0],[1250.0,400.0],[660.0,180.0],[410.0,250.0], [420.0,555.0],[575.0,665.0],[1150.0,1160.0],[700.0,580.0],[685.0,595.0], [685.0,610.0],[770.0,610.0],[795.0,645.0],[720.0,635.0],[760.0,650.0], [475.0,960.0],[95.0,260.0],[875.0,920.0],[700.0,500.0],[555.0,815.0], [830.0,485.0],[1170.0, 65.0],[830.0,610.0],[605.0,625.0],[595.0,360.0], [1340.0,725.0],[1740.0,245.0]])
def getdistmat(coordinates):
num = coordinates.shape[0]
distmat = np.zeros((52,52))
for i in range(num):
for j in range(i,num):
distmat[i][j] = distmat[j][i]=np.linalg.norm(coordinates[i]-coordinates[j]) return distmat
distmat = getdistmat(coordinates)
numant = 40 #蚂蚁个数
numcity = coordinates.shape[0] #城市个数
alpha = 1 #信息素重要程度因子
beta = 5 #启发函数重要程度因子
rho = 0.1 #信息素的挥发速度
Q = 1
iter = 0itermax = 250
etatable = 1.0/(distmat+np.diag([1e10]*numcity)) #启发函数矩阵,表示蚂蚁从城市i转移到矩阵j的期望程度
pheromonetable = np.ones((numcity,numcity)) # 信息素矩阵
pathtable = np.zeros((numant,numcity)).astype(int) #路径记录表
distmat = getdistmat(coordinates) #城市的距离矩阵
lengthaver = np.zeros(itermax) #各代路径的平均长度
lengthbest = np.zeros(itermax) #各代及其之前遇到的最佳路径长度
pathbest = np.zeros((itermax,numcity)) # 各代及其之前遇到的最佳路径长度
while iter 《 itermax:
# 随机产生各个蚂蚁的起点城市
if numant 《= numcity:#城市数比蚂蚁数多
pathtable[:,0] = np.random.permutation(range(0,numcity))[:numant]
else: #蚂蚁数比城市数多,需要补足
pathtable[:numcity,0] = np.random.permutation(range(0,numcity))[:]
pathtable[numcity:,0] = np.random.permutation(range(0,numcity))[:numant-numcity] length = np.zeros(numant) #计算各个蚂蚁的路径距离
for i in range(numant):
visiting = pathtable[i,0] # 当前所在的城市
#visited = set() #已访问过的城市,防止重复
#visited.add(visiting) #增加元素
unvisited = set(range(numcity))#未访问的城市
unvisited.remove(visiting) #删除元素
for j in range(1,numcity):#循环numcity-1次,访问剩余的numcity-1个城市
#每次用轮盘法选择下一个要访问的城市
listunvisited = list(unvisited)
probtrans = np.zeros(len(listunvisited))
for k in range(len(listunvisited)):
probtrans[k] = np.power(pheromonetable[visiting][listunvisited[k]],alpha)\
*np.power(etatable[visiting][listunvisited[k]],alpha)
cumsumprobtrans = (probtrans/sum(probtrans)).cumsum()
cumsumprobtrans -= np.random.rand() k = listunvisited[find(cumsumprobtrans》0)[0]] #下一个要访问的城市
pathtable[i,j] = k unvisited.remove(k) #visited.add(k) length[i] += distmat[visiting][k] visiting = k length[i] += distmat[visiting][pathtable[i,0]] #蚂蚁的路径距离包括最后一个城市和第一个城市的距离 #print length
# 包含所有蚂蚁的一个迭代结束后,统计本次迭代的若干统计参数
lengthaver[iter] = length.mean()
if iter == 0:
lengthbest[iter] = length.min()
pathbest[iter] = pathtable[length.argmin()].copy()
else:
if length.min() 》 lengthbest[iter-1]: lengthbest[iter] = lengthbest[iter-1] pathbest[iter] = pathbest[iter-1].copy()
else:
lengthbest[iter] = length.min() pathbest[iter] = pathtable[length.argmin()].copy()
# 更新信息素 changepheromonetable = np.zeros((numcity,numcity))
for i in range(numant):
for j in range(numcity-1):
changepheromonetable[pathtable[i,j]][pathtable[i,j+1]] += Q/distmat[pathtable[i,j]][pathtable[i,j+1]] changepheromonetable[pathtable[i,j+1]][pathtable[i,0]] += Q/distmat[pathtable[i,j+1]][pathtable[i,0]] pheromonetable = (1-rho)*pheromonetable + changepheromonetable iter += 1 #迭代次数指示器+1
#观察程序执行进度,该功能是非必须的
if (iter-1)%20==0:
print iter-1
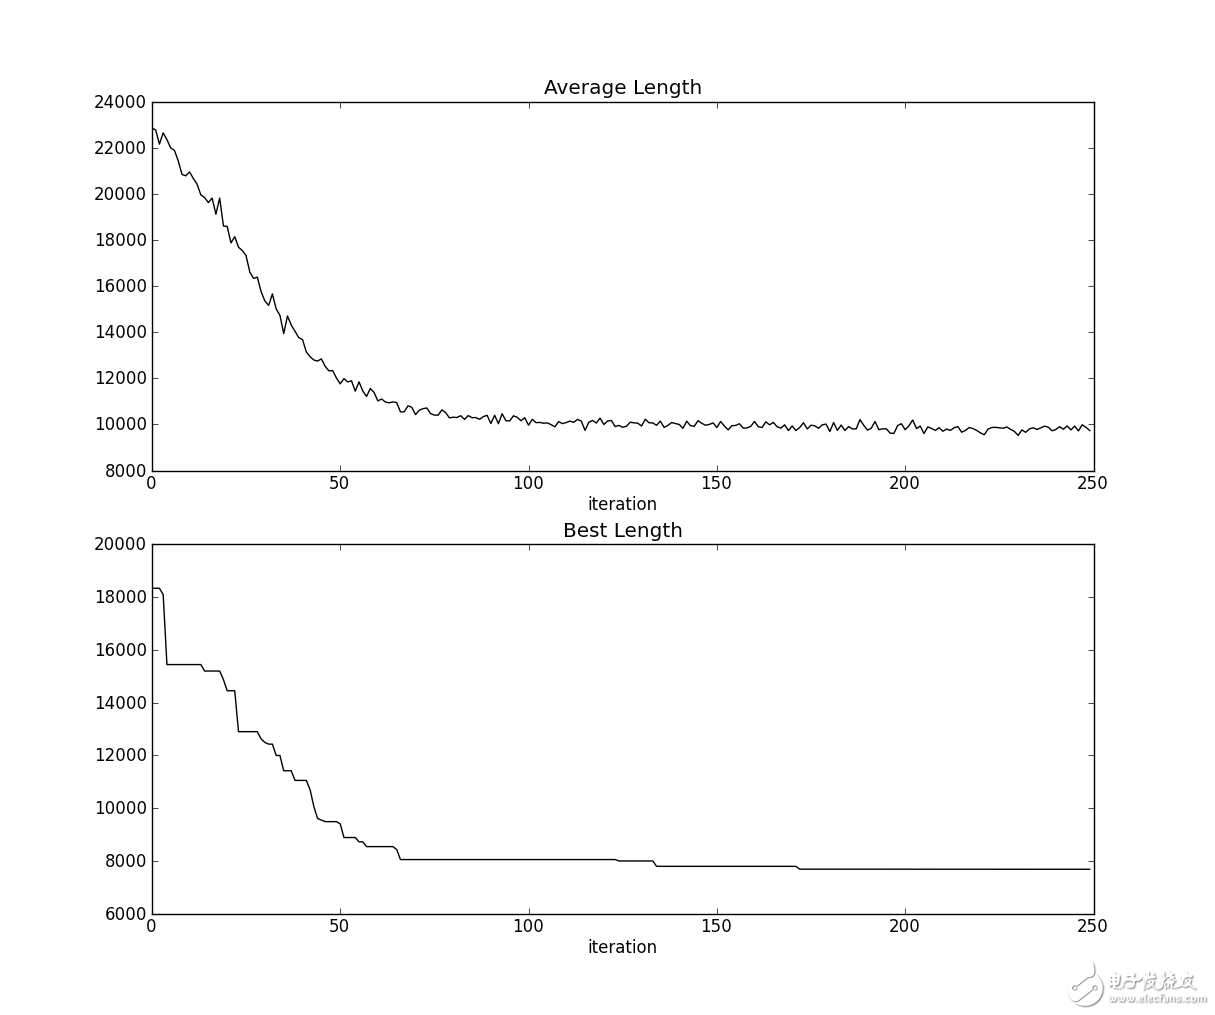
# 做出平均路径长度和最优路径长度
fig,axes = plt.subplots(nrows=2,ncols=1,figsize=(12,10))
axes[0].plot(lengthaver,‘k’,marker = u‘’)
axes[0].set_title(‘Average Length’)axes[0].set_xlabel(u‘iteration’)
axes[1].plot(lengthbest,‘k’,marker = u‘’)
axes[1].set_title(‘Best Length’)
axes[1].set_xlabel(u‘iteration’)fig.savefig(‘Average_Best.png’,dpi=500,bbox_inches=‘tight’)
plt.close()
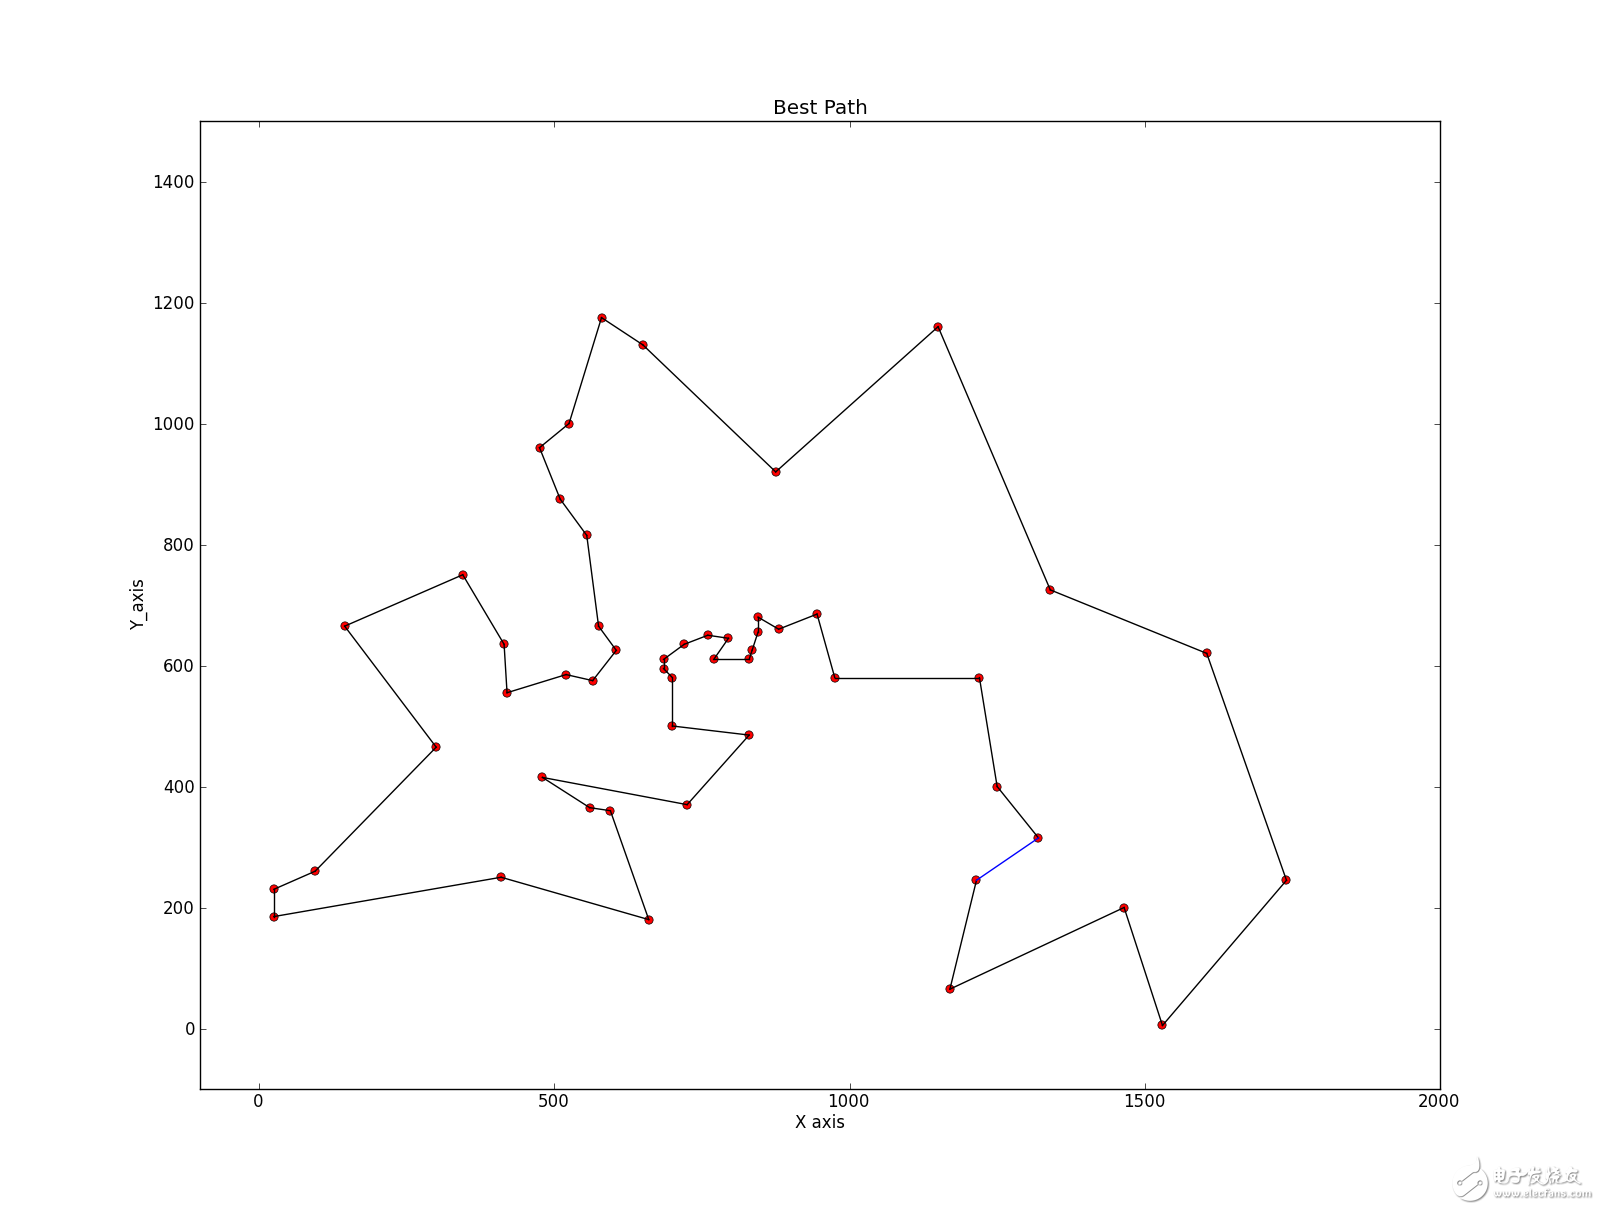
#作出找到的最优路径图bestpath = pathbest[-1]
plt.plot(coordinates[:,0],coordinates[:,1],‘r.’,marker=u‘$\cdot$’)
plt.xlim([-100,2000])
plt.ylim([-100,1500])
for i in range(numcity-1):#
m,n = bestpath[i],bestpath[i+1]
print m,n plt.plot([coordinates[m][0],coordinates[n][0]],[coordinates[m][1],coordinates[n][1]],‘k’)
plt.plot([coordinates[bestpath[0]][0],coordinates[n][0]],[coordinates[bestpath[0]][1],coordinates[n][1]],‘b’)
ax=plt.gca()
ax.set_title(“Best Path”)
ax.set_xlabel(‘X axis’)
ax.set_ylabel(‘Y_axis’)
plt.savefig(‘Best Path.png’,dpi=500,bbox_inches=‘tight’)
plt.close()


总结
以上就是本文关于Python编程实现蚁群算法详解的全部内容,希望对大家有所帮助。有什么问题可以随时留言,小编会及时回复大家的。感谢朋友们对本站的支持!
-
大家来讨论一下用蚁群算法实现路径规划的硬件实现问题2013-04-26 0
-
NHLERE:应用蚁群算法的WSN路由算法2010-04-24 0
-
MATLAB蚁群算法程序汇集篇2013-03-30 0
-
有没有蚁群算法的matlab编程代码2013-04-03 0
-
蚁群算法参数优化2009-04-22 891
-
基于云模型的参数自适应蚁群遗传算法2011-02-23 777
-
基于蚁群算法的纺织企业生产调度技术研究2015-12-24 678
-
蚁群算法及其应用2015-12-25 766
-
蚁群算法实现求解TSP问题_郝春梅2017-03-19 923
-
基于蚁群算法的迭代思想的信息素更新规则2017-11-17 978
-
蚁群算法是什么能做什么_蚁群算法的优势在哪里?2018-02-02 28469
-
蚁群算法基本原理及其应用实例2018-02-02 92682
-
蚁群算法即相关代码实现详解—matlab之智能算法2018-02-02 11102
-
蚁群算法解决tsp问题2018-02-02 7522
-
蚁群算法的基本原理及其改进算法.ppt2018-04-23 1235
全部0条评论

快来发表一下你的评论吧 !

